Machine learning models for stock prediction

A trend line uses one clue: the day number. A moving average uses one clue: the recent average. Machine learning is greedy in the best way: it takes many clues at once and learns, from the data itself, how much to trust each one. Here you will build the clues, split the data properly, and train a real model right in your browser.
From one clue to many: features
Think about predicting whether your friend will be late. You do not use one fact, you blend several: how they slept, the traffic, the weather, their track record. Each fact is a feature. To predict NCB's price for a day, we build features from the days just before it:
Every feature is built only from days before the one we predict. That rule is sacred: if a feature ever peeks at the answer, the model looks brilliant in practice and fails in real life.
A feature is one measurable clue the model is allowed to use. Good features carry real information about what comes next. Choosing them well is often more important than which model you pick.
The golden rule: train and test
Here is a trap. If you let a model study all the data and then grade it on that same data, of course it scores well, it has seen the answers. That tells you nothing about the future. So we split the days in time:
The model learns its weights here, fitting the features to the known prices.
Held back and hidden during training. We only check the model here, which is a fair stand-in for the future.
Splitting by time, not at random, matters for prices: you must always train on the past and test on the future, never the reverse. The test error is the only number you should believe.
The model itself
Our model is a linear regression, the number-predicting cousin of the win-or-lose model from the football course. It gives each feature a weight and adds them up:
"Training" just means the computer searches for the weights \(w\) that make the error on the training days as small as possible, the same error you measured by hand in Lesson 3. Then it uses those weights on the test days it never saw.
How to use this lab
- Tick the features the model is allowed to use.
- Press Train the model. It fits weights on the early days, then predicts the last 5 days it never saw.
- Compare the gold predictions to the teal real prices, and read the test error against the naive baseline. Lower is better.
The truth about markets
Notice something in the lab: even a good model only just edges out "tomorrow equals today," and on calm stretches it can lose. That is not a bug. Prices are close to random in the short term because thousands of smart people are already trading on every scrap of news, so the easy patterns get used up almost instantly. This idea has a name, the efficient market, and it is why nobody can reliably predict tomorrow's exact price.
Small edges are the real goal, not magic. Real prices can jump on news no model saw coming, and you can lose money. Nothing in this course is financial advice, and a good forecaster is the first to say "here is my best guess, and here is how unsure I am." That candour is the mark of a real professional, the kind Adrian trusts.
The three machine learning models the pros use
The browser lab used a linear regression, the gentlest machine learning model. When analysts want more power on real stock data, three models do most of the heavy lifting.
- Random forest grows hundreds of decision trees on random slices of the data and averages their votes. It rarely overreacts to one weird day, which makes it a safe first pick.
- Gradient boosting (the famous version is XGBoost) builds trees in a chain, each new tree focused on the mistakes of the ones before it. On tabular features like ours it is often the single strongest model, and a favourite in real trading competitions.
- LSTM (Long Short-Term Memory) is a neural network with a memory, designed for sequences like prices, text, and music. It can catch longer patterns a single tree would miss, but it is hungry for data and computing power.
Notice the pattern: all three build on ideas from the football course, decision trees and neural networks, just scaled up and pointed at prices.
Try each model yourself
Each machine learning model now has its own hands-on deep dive: a plain-words explanation, a game you can play, and a live chart on real NCB data. Grow a forest, chain a booster, and test a memory cell.
 Random forestGrow trees one by one and watch their votes average out.Open the interactive →
 Gradient boostingAdd correcting trees that shrink the leftover errors.Open the interactive →
 LSTM neural netPlay with a forget gate and test the model's memory.Open the interactive →
Read the moving average
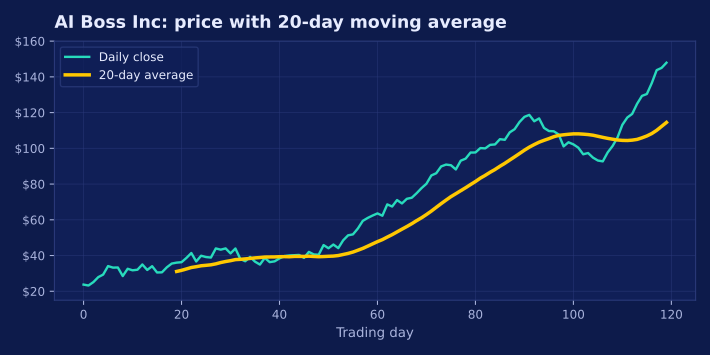
Here is AI Boss Inc again, this time with its 20-day moving average drawn in gold on top of the daily price.
- Features are the clues, built only from days before the one you predict.
- Train and test: learn on early days, check fairly on later days you hid.
- A linear regression weighs the features and adds them up; training finds the best weights.
- Markets are close to random short term, so aim for a small real edge, never certainty.
Next: do all of this in a few lines of real Python.